
A power station charging limit can explain a battery that charges normally, then stops at 80% or 90%. First check whether that percentage matches a saved charge target. If it doesn’t, note the warning icons, input watts, connected loads and whether the battery ever reached a higher level. Those details tell you which check to make next.
This guide is for a station that has already accepted charge. If it never registers input from a supported source, start with our charging troubleshooting guide. A repeatable stop at one percentage needs a different record from a charger that never starts.
Before another attempt, inspect the unit and disconnected cables. Stop using damaged, swollen, wet or abnormally hot equipment and follow the manufacturer’s support or emergency instructions. The checks below stay with supported controls and external observations.

What happened before the percentage stopped?
You plug the station in the evening before a trip. It rises from a partly discharged state to 80%, then sits there. That’s frustrating when you expected a full battery, but the number alone doesn’t identify a fault.
Check the sequence. Did it climb to 80% and stop while connected? Did it reach 100%, sit unused, and later show 80%? Or did it slow near full while still taking some input? Write down which one you actually saw. A photo taken the next morning can’t establish the earlier charging behavior.
For example, Omnicharge’s PowerStation 30C+ charging FAQ says that the Power 30C+ stops charging at 100% and self-depletes to 80% after an extended period of non-use. That is a model-specific explanation for a later decline. It does not explain every station that never charges beyond 80%.
Use this table to choose the first check. The observations suggest a branch; they aren’t a diagnosis by themselves.
| What you observe | First check | Useful evidence |
|---|---|---|
| It repeatedly stops exactly at a saved target | Check the supported upper charge setting | Target in the app or device, plus stop percentage |
| Charging stops with a temperature warning | Follow the exact model’s warning instructions | Icon or code, location and recent charging history |
| Input continues but the percentage barely moves | Check connected loads and the source | Input/output readings taken at the same time |
| It reached full earlier, then showed less after sitting unused | Check documented standby or storage behavior | Full-charge time, later reading and idle duration |
| Screen and app disagree, or the percentage jumps | Record both displays and ask about gauge behavior | Photos, software versions and timing |
1. Check the power station charging limit against the saved target
Open the controls supported by your exact model. Look for a charge target, upper recharge level or another documented setting that determines where charging ends. A control measured in percent may set that endpoint. A control measured in watts sets a charging rate; record the label and units before changing it.
Take a screenshot of the power station charging limit setting. If the upper target says 80% and the station stops at 80%, the behavior is consistent with that setting. Confirm it in the manual or manufacturer guidance before deciding that the battery is faulty.
If you need a different level for the trip, change the power station charging limit only within the supported range and let the unit continue under normal charging conditions. Confirm that the setting saved, then watch whether it passes the old endpoint. A target change on a disconnected app screen hasn’t shown that the device applied it.
Don’t copy an app menu path from another product. Features, wording and firmware vary. The EcoFlow RIVER 2 and RIVER 2 240 manual identifies a “Discharge/Recharge level limitation” indicator on the LCD. The page reviewed here doesn’t establish an 80% default or a universal app slider path. Use the controls documented for your unit.
A label such as “80% capacity after 3,000 cycles” answers a separate question. The RIVER 2 manual uses that specification to describe retained battery capacity after cycling. It isn’t an instruction to stop today’s charge at 80%. Capacity retention and displayed state of charge measure different things.
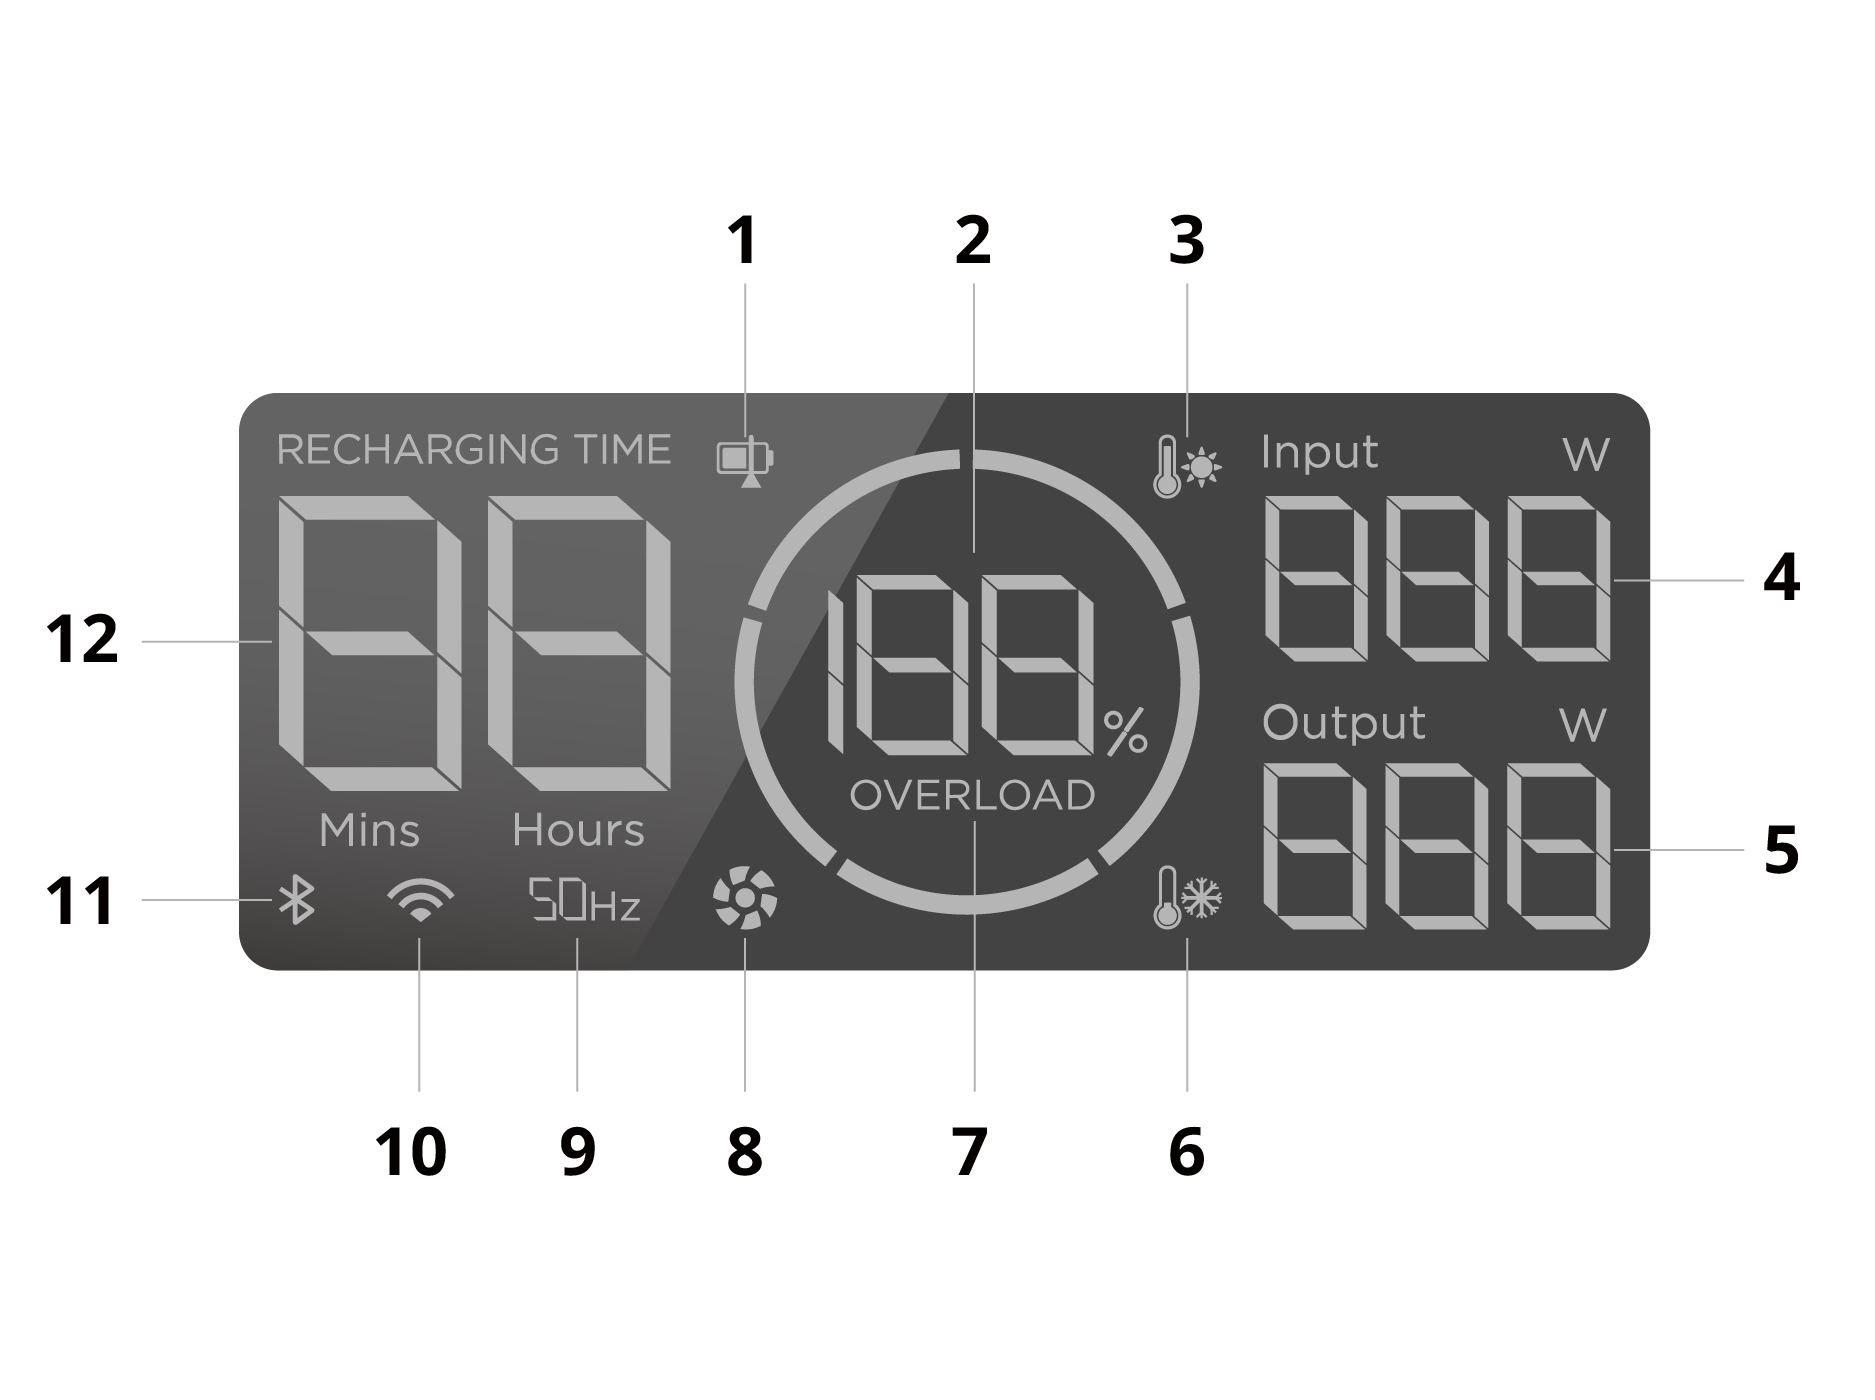
Charging speed modes need a different check
The BLUETTI EB3A manual, page 12, describes Standard, Turbo and Silent charging modes. It says Turbo and Silent can be enabled through the BLUETTI app. Those are charging modes; the passage doesn’t specify an 80% or 90% upper target.
If you changed a speed mode yesterday, include that in your record. A slower input can lengthen a session, but the mode name alone doesn’t establish a power station charging limit. Avoid changing the rate and target together, because you won’t know which change affected the result.
2. Read the warning before trying to charge further
A temperature icon beside an 80% reading deserves attention even if you found a power station charging limit. Follow the warning instructions first. A saved endpoint and a protection warning can exist in the same session.
The allowable charging range belongs to the product. The RIVER 2/RIVER 2 240 manual lists an ambient charging range of 0–45°C (32–113°F). The EB3A manual, page 8, lists 0–40°C (32–104°F). Even these two small stations have different upper limits.
Ambient temperature describes the surroundings. It doesn’t show the temperature inside a battery that has just worked hard or sat in a hot car. Note where the station has been, whether its vents have the documented clearance and which warning is displayed. The EB3A LCD guide, page 9, lists its Temperature Anomaly Alert separately from battery capacity and input power.
Move intact equipment only as the manual permits, and allow it to return to documented operating conditions. Don’t heat a cold battery with a hair dryer, chill a hot one in a freezer, cover ventilation, or override protection to reach a higher percentage. If the warning persists under suitable conditions, send the code and history to support.
A useful support photo includes the whole display. Cropping down to “80%” can remove the icon that explains why charging paused. Take it before following any manufacturer-approved recovery procedure so you retain the original evidence.
3. Check input power and connected loads together
Charging input can supply connected equipment while battery percentage rises slowly, stays steady or falls. Anker SOLIX’s partial-charging guide discusses charge ceilings and the effect of running loads while charging. Record input and output at the same moment, along with the connected equipment.
For a simpler check, pause nonessential loads using their normal controls, if appropriate for your setup. Observe charging from one manufacturer-supported source. If the battery now moves beyond the earlier percentage, connected consumption was part of the observation. That result still doesn’t identify every internal energy path.
In a supported bypass or EPS arrangement, displayed input may include power serving an appliance. Don’t subtract two screen numbers and present the result as a measured battery charging rate unless the manufacturer explains what those displays measure. Record the readings as displayed and describe the mode.
Solar adds another variable. A cloud can reduce available input just as the battery reaches 80%. If the apparent stop moves with sunlight or appliance use, follow the slow solar charging checks. Panel voltage, connectors and charging ports must remain within specifications during a comparison.
Where the manual permits, a normal wall-charging session can provide a more stable comparison than changing sunlight. Use the specified charger or cable and a suitable outlet. The RIVER 2 instructions call for its original AC charging cable and a direct wall connection. Don’t assume a different adapter is compatible because its plug fits.
Record whether the percentage stays fixed with loads paused and a supported source available. If input disappears altogether, return to source-based troubleshooting. If input remains present with no warnings and the power station charging limit is higher, keep that evidence for the next check.
4. Separate the charge endpoint from a later display change
Check the unit’s screen and, where supported, the connected app. Write down both readings with the time. If they disagree, establish whether the app is connected and showing current device data. A stale app value is poor evidence for where charging ended.
Capture three moments during an ordinary supported session: when input starts, when percentage appears to stop, and a later check. Include input power and warnings. You don’t need to force a full discharge to collect that history.
A battery that reaches 100% and later displays 90% has followed a different sequence from one that stops at a power station charging limit of 90%. Check model-specific standby behavior, continued outputs and manufacturer guidance before calling either sequence normal. The Power 30C+ example applies to that product’s documented idle behavior.
A jump in percentage, persistent screen/app disagreement, or unexpected shutdown can raise a separate gauge question. Our battery percentage and calibration checks explain that task. Follow an exact-model procedure or support instruction; this guide doesn’t prescribe a recurring 0–100% cycle.
Likewise, a small decline from full or a pause near 99% cannot prove that every cell is healthy. EcoFlow’s partial-charging article discusses near-full behavior alongside temperature, sources and firmware. Percentage alone cannot distinguish all those causes or replace a fault assessment.
5. Make one supported change and keep the result
Choose the change matching the evidence. If the documented power station charging limit equals the stop percentage, adjust it if needed. If a warning is active, follow its instructions. If consumption complicates the reading, compare with nonessential loads paused. Leave unrelated settings alone during the comparison.
Use the observation period given by the manufacturer. There is no single waiting time that proves a fault across battery sizes, source powers and charging modes. Note actual elapsed time and percentage trend so support can interpret them for your model.
Here’s a hypothetical example, not a test result: a station starts below 80%, charges to 80% twice, and its connected app shows a supported upper target of 80%. The owner saves a higher supported target and the next ordinary session passes 80% without a warning. That sequence supports the saved-target explanation. It doesn’t justify disabling protection or changing a different model’s settings.
A session that stops at varying percentages with a temperature warning needs a different response. Raising the target won’t address that warning. An 80% reading after a documented full charge and extended idle period also needs its earlier history checked.
If the station remains below the saved power station charging limit with a supported source, appropriate conditions and no explanatory warning, contact the manufacturer. Keep the enclosure closed. An unexplained charging stop is insufficient evidence to diagnose a failed cell, order a battery, or try a generic reset from another product.
Copy this charging record for support
| Field | What to write down |
|---|---|
| Product identity | Exact model and region/version; share the serial number privately with support |
| Software | Firmware and app versions, if available |
| Saved controls | Power station charging limit, charging mode, and any documented schedule or reserve setting |
| Source | Approved charger/cable and source used |
| Starting state | Time, percentage, input reading and connected loads |
| Apparent stop | Time, percentage, input/output readings and full warning text or icons |
| Conditions | Location, recent hot/cold exposure and ventilation arrangement |
| Later observation | Time, screen/app readings and whether input or outputs stayed active |
| Single change | Supported setting or condition changed, and what happened afterward |
Attach the relevant manual page and clear display photos. A sequence such as “started at this level, stopped here, target was this, warning showed this” is more useful than “won’t charge fully.” Mark any unobserved stage unknown instead of filling it in from memory.
Questions about an 80% or 90% charging stop
Can I change the power station charging limit on every model?
No. Check the model’s supported controls. It may offer a recharge target, a rate setting, or other controls, and a mode name doesn’t establish which you have. Battery chemistry and another model’s app screenshot cannot confirm an adjustable upper limit.
Should I raise an 80% target before a trip?
Use the manufacturer’s supported settings for the energy you need. Confirm that the power station charging limit is set to 80% and that no warning needs attention. After changing it, verify that it saved and observe the result before relying on the station away from home.
Is an 80% reading a sign that the battery has worn out?
The reading alone doesn’t establish wear. Compare the target, warnings and history. A cycle-life specification expressed as retained capacity describes aging under specified conditions; it isn’t the same as today’s state-of-charge reading.
What if none of these observations fits?
Save the record and ask support which exact-model check applies. Use our power station troubleshooting hub to choose another guide if the symptom changes to no input, output shutdown or an overload warning.
Research method: this guide compares manufacturer documentation and charging guidance. It does not report hands-on tests by Wild Smart Gear. Check limits and controls against the instructions for your own product and region.
